The definitive data on federal rates, corporate spending trends, and the widening gap between reimbursement standards and actual travel costs
Global business travel spending is forecast to reach $1.71 trillion in 2026. This creates a tension for finance teams and travel managers, with actual trip costs having risen while the standard CONUS reimbursement rate sits unchanged at $178 per day. Companies using platforms with built-in travel policy controls can enforce per diem limits at the point of booking rather than auditing overages after the fact. The statistics below reveal exactly where the gaps exist and what they mean for travel programs in 2026.
Key Takeaways
- Federal per diem rates remain flat despite rising costs: The standard CONUS rate holds at $178 per day for FY 2026, while actual per-trip spending jumped to $1,128 on average.
- Federal per diem rates remain flat while reported trip spending has increased: The standard CONUS rate holds at $178 per day for FY 2026. In GBTA’s 2025 traveler survey, average reported trip spending reached $1,128, up from $834 in its 2024 survey.
- Corporate travel budgets are expanding: Companies project a 5% increase in travel budgets globally for 2026, signaling confidence in the value of in-person business.
- Expense management adoption lags behind spending growth: Only 67% of business travelers currently use expense management systems, leaving one-third of travel spend harder to track.
- Hotel rates will continue climbing: Room rates are forecast to increase 4.9% in 2026, outpacing airfare growth and putting more pressure on lodging allowances.
Global Business Travel Market Size and Spending Trends
The business travel market has fully recovered from pandemic-era contractions and now projects aggressive growth through the end of the decade. These figures establish the scale of corporate travel spending and explain why per diem policy decisions carry significant financial weight.
1. Global business travel market valued at $1.38 trillion in 2025
The worldwide business travel market reached $1,380 billion in 2025, with projections pointing to $1,483 billion in 2026. This represents a mature market returning to growth after several years of disruption, with corporate travel now considered essential rather than discretionary for most organizations.
2. Market projected to reach $2.77 trillion by 2034
Business travel spending is expected to grow to $2,765 billion by 2034, exhibiting a compound annual growth rate of 8.10%. Travel managers planning multi-year programs should anticipate sustained volume increases that will compound any per diem policy gaps over time.
3. U.S. business travel spending projected at $320.6 billion in 2026
Domestic spending is forecast to reach $320.6 billion in 2026, up from $314.5 billion in 2025. The U.S. market alone represents roughly one-fifth of global business travel activity, making federal per diem rates particularly consequential for American companies.
4. United States and China represent 58% of top markets
Together, the U.S. and China account for 58% of the $1.31 trillion spent by the top 15 business travel markets. Companies operating in these regions face the highest absolute travel costs and the greatest need for systematic per diem controls.
5. Corporate travel budgets rising 5% globally in 2026
Organizations worldwide are planning 5% budget increases for corporate travel in 2026, with European companies expecting 5.8% growth and U.S. companies 4.9%. These increases reflect both rising costs and renewed investment in face-to-face business activities.
Federal Per Diem Rates for FY 2026
The General Services Administration sets per diem rates that apply to federal employees and serve as benchmarks for many private-sector travel policies. Understanding these rates helps companies establish compliant reimbursement structures. Companies using real-time dashboards can monitor actual spending against these benchmarks by department, project, or cost code.
6. Standard CONUS per diem rate remains at $178 per day
The GSA maintained the standard continental U.S. rate at $178 per day for FY 2026: $110 for lodging and $68 for meals and incidental expenses. This rate applies to locations not designated as non-standard areas with higher costs of living. For FY2027, the standard rate rose to $181 a day ($113 lodging plus $68 M&IE). Every city's new cap is in our per diem rates lookup.
7. IRS high-cost area rate set at $319 per day
For high-cost locations, the IRS high-low substantiation method allows $319 per day in FY 2025-2026: $233 for lodging and $86 for meals and incidentals. Companies can use this simplified method to reimburse employees without requiring itemized receipts.
8. Low-cost area rate established at $225 per day
Non-high-cost localities qualify for $225 per day under the IRS method: $151 for lodging and $74 for M&IE. The gap between high-cost and low-cost rates, nearly $100 per day, demonstrates why location-based policy controls matter.
9. 296 non-standard areas carry higher per diem rates
The GSA designates 296 non-standard areas across the United States with per diem rates above the standard $178 threshold. These localities reflect higher costs for lodging, meals, or both, and require travel managers to apply location-specific reimbursement rules.
10. First and last travel days calculated at 75% of full M&IE rate
Per diem regulations require that meals and incidental expenses on first and last travel days be calculated at 75% of the full daily rate. This partial-day calculation affects total trip reimbursements and should be built into pre-trip budgeting. Our per diem expense report template applies it automatically.
High-Cost Location Per Diem Variations
Certain cities and regions far exceed standard per diem rates, creating budget pressure for companies with frequent travel to these destinations.
11. New York City lodging per diem reaches $342 in peak months
New York City’s FY 2026 GSA lodging allowance reaches $342 per night in October through December and again in September, while falling to $179 in January and February. The city’s $92 M&IE allowance brings the peak federal per diem total to $434 per day.
12. New York business travel costs reached $670 per day in Q4 2024
Business Travel News’ Corporate Travel Index reported a $670 total daily cost for New York City in Q4 2024, ranking it as the most expensive city in the index. The index combines hotel, rental-car, and meal costs, providing a broader corporate-travel cost benchmark than GSA’s lodging and M&IE reimbursement rates.
13. Europe carries highest regional per diem at $360 average
Across the continent, European business travel averages $360 per day in per diem costs. Companies with transatlantic operations must account for this premium when setting travel budgets and policy limits.
14. London per diem approximates $600 per day
Business travel to London requires approximately $600 per day, placing it among the world's most expensive destinations. Finance teams managing UK travel should build significant buffers into per diem allowances for the capital.
15. U.S. business travel per diem held steady at $347 per day
The national average for U.S. business travel remained $347 per day in Q4 2024, nearly double the standard CONUS rate. This spread illustrates why one-size-fits-all per diem policies often fail to match actual costs.
Corporate Travel Spending and Cost Trends
Beyond per diem rates, broader spending patterns reveal how travel costs are evolving. These metrics help finance teams anticipate budget requirements and identify areas where cost control measures can have the greatest impact. Engine's consolidated billing eliminates the reconciliation work that comes with scattered per-trip expenses.
16. Average per-trip spending jumped 35.3% to $1,128
GBTA’s 2025 traveler survey found average trip spending of $1,128, compared with $834 in its 2024 survey. The figures show a substantial increase in reported spending among surveyed business travelers and reinforce the importance of regularly reviewing travel budgets and policy limits.
17. Hotel bookings forecast to increase 6.3% in 2026
Lodging volume is expected to grow 6.3% in 2026, with room rates climbing 3.9% on top of that volume increase. The combination of more nights and higher rates compounds the impact on travel budgets.
18. Hotel rates projected to rise 4.9% globally in 2026
Room rates across all markets are forecast to increase 4.9% in 2026, while airfares rise just 1.1%. This divergence means lodging will consume a larger share of travel budgets, making hotel cost control increasingly important.
19. Airfares forecast to rise 3.7% in 2026
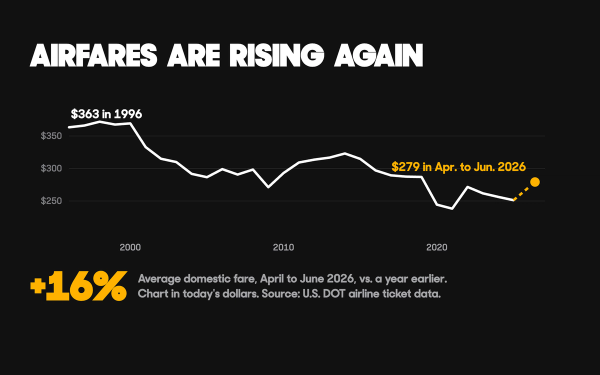
Flight costs are expected to increase 3.7% in 2026, the first time growth expectations strengthened between survey periods since 2022. Combined with hotel increases, total trip costs will continue climbing above per diem benchmarks.
20. Global average trip cost is about $1,600
The global average total trip cost is about $1,600, with regional costs varying significantly. Asia, for example, averaged $972. These differences reinforce the value of setting travel budgets according to destination and regional market conditions.
Expense Management and Payment Adoption
How companies track and pay for travel expenses directly affects their ability to enforce per diem compliance. Gaps in expense system adoption create blind spots where spending can exceed allowances undetected.
21. 67% of business travelers use expense management systems
Only 67% of business travelers currently use expense management systems to track their spending. The remaining third relies on manual processes that make per diem compliance harder to verify.
22. 69% of travelers have corporate card access
Corporate card penetration stands at 69% globally, with North America leading at 73%. Card programs provide transaction-level visibility but require integration with travel systems to enforce per diem limits proactively.
23. Only 50% of corporate cardholders required to use their cards
Despite card availability, just 50% of employees with corporate cards are required to use them for business expenses. This policy gap allows significant spending to occur outside trackable channels.
24. Mobile wallet adoption reaches 64% globally
Digital payment methods have achieved 64% adoption among business travelers worldwide, rising to 72% in Asia Pacific. Mobile payments create new opportunities for real-time expense capture and per diem monitoring.
25. Manufacturing accounts for nearly one-third of global spending
The manufacturing sector represents nearly one-third of global business travel expenditure. Companies in this industry face particular pressure to control per diem costs across large traveling workforces.
Travel Volume and Booking Behavior
Understanding how often employees travel and what happens to their bookings reveals the operational challenges of per diem management. High modification rates and increased trip frequency both complicate expense tracking.
26. 74% of travelers took between one and five trips last year
The majority of business travelers, 74% by volume, completed between one and five trips in the past twelve months. This moderate-frequency traveler population benefits most from clear per diem policies that set expectations before each trip.
27. Over 80% of travelers match or exceed pre-2019 travel levels
More than 80% of business travelers report traveling as much or more than they did before 2019. This recovery confirms that remote work has not permanently replaced face-to-face business activities.
28. Only 8% of travel volume expected to shift permanently to virtual
The virtual meeting substitution effect has stabilized, with just 8% of travel volume expected to shift permanently to remote alternatives in 2026. This is down from as much as 29% in surveys from 2021-2024, confirming that business travel demand has normalized.
29. 86% of business travelers rate their trips as worthwhile
An overwhelming 86% of travelers consider their business trips valuable. This satisfaction level supports continued investment in travel programs while reinforcing the need for per diem policies that enable rather than restrict productive trips.
What the Data Means for Travel Programs in 2026
The statistics above show that reimbursement benchmarks and total trip spending measure different parts of the travel budget. The standard federal CONUS rate is $178 per day for lodging and M&IE, while GBTA’s 2025 traveler survey reported average spending of $1,128 per business trip across surveyed travelers. Companies therefore need policies that account for destination, trip length, and which expense categories are covered.
- First, they can accept the gap and reimburse actual expenses regardless of guidelines. This approach provides traveler satisfaction but creates budget unpredictability and compliance risk.
- Second, they can enforce strict per diem limits and require employees to absorb overages. This protects budgets but damages traveler experience and may affect recruiting and retention.
- Third, they can use booking systems that enforce per diem compliance at the point of reservation. When travel policies hide out-of-policy options rather than flagging them after booking, travelers only see hotels and flights within their allowance. There is no overage to audit because the overage never occurred.
Companies using platforms that consolidate booking and expense data eliminate the reconciliation work that comes with scattered per-trip reports. Engine's DirectBill, for example, extends a line of credit, pays the hotels, and provides one itemized invoice after stays, removing the need to chase individual folios.
For organizations with group travel needs of nine or more rooms, dedicated trip managers can negotiate custom rates that align with per diem budgets while handling rooming lists, contracts, and post-trip reconciliation at no additional cost. This approach turns unpredictable group expenses into managed, documented outlays.
Building Compliant Travel Programs Without Sacrificing Flexibility
The data on booking modifications presents a specific challenge for per diem compliance. Rigid cancellation policies turn schedule changes into lost budget.
FlexPro and Flex address this directly. FlexPro is a subscription covering all company hotel bookings, with cancellation until noon on check-in day including non-refundable rates. The default refund is issued as Engine travel credit valid for one year. FlexPro costs $299 per month or $2999 per year. Flex covers hotels per booking and lets travelers cancel flights up to two hours before the first departure.
When plans change, the per diem budget stays intact rather than absorbing cancellation fees.
The combination of real-time dashboards, policy enforcement at booking, consolidated billing through DirectBill, and cancellation protection creates a closed loop. Travel managers see spend by department and project. Finance teams receive one invoice instead of hundreds of expense reports. Travelers book within policy without friction because out-of-policy options simply do not appear.
Engine serves 40,000+ active businesses as of October 2026 and offers access to 1,000,000+ properties worldwide. The booking platform and Engine Groups service are free to use, with no platform fees, no membership fees, no agent-assist fees, no contracts, and no minimum spend.
Frequently Asked Questions
What is the standard federal per diem rate for 2026?
The GSA standard CONUS per diem rate for FY 2026 is $178 per day, consisting of $110 for lodging and $68 for meals and incidental expenses. New York City reaches $342 for lodging in its peak months, while Nantucket reaches $471 from June through September.
How do per diem rates differ between high-cost and low-cost locations?
The IRS high-low substantiation method allows $319 per day for high-cost areas and $225 per day for low-cost localities. The high-cost rate includes $233 for lodging and $86 for M&IE, while the low-cost rate provides $151 for lodging and $74 for M&IE. This nearly $100 daily difference demonstrates why location-aware travel policies matter for compliance.
Why is there a gap between per diem rates and actual travel costs?
Federal per diem and broader business-travel cost benchmarks cover different expense categories. For FY 2026, New York City’s federal allowance reaches $342 for lodging plus $92 for M&IE during peak months. Business Travel News’ Q4 2024 Corporate Travel Index reported a broader $670 daily NYC cost that includes hotel, rental-car, and meal expenses. GBTA separately reported average trip spending of $1,128 in its 2025 traveler survey. These benchmarks help companies evaluate different parts of the total travel budget.
How can companies enforce per diem compliance without creating friction for travelers?
The most effective approach is policy enforcement at the point of booking rather than after-the-fact auditing. When travel platforms hide out-of-policy options, travelers only see hotels and flights within their allowance. There is no overage to review because the booking itself was compliant. This eliminates both the administrative burden of expense audits and the traveler frustration of having reimbursements denied.